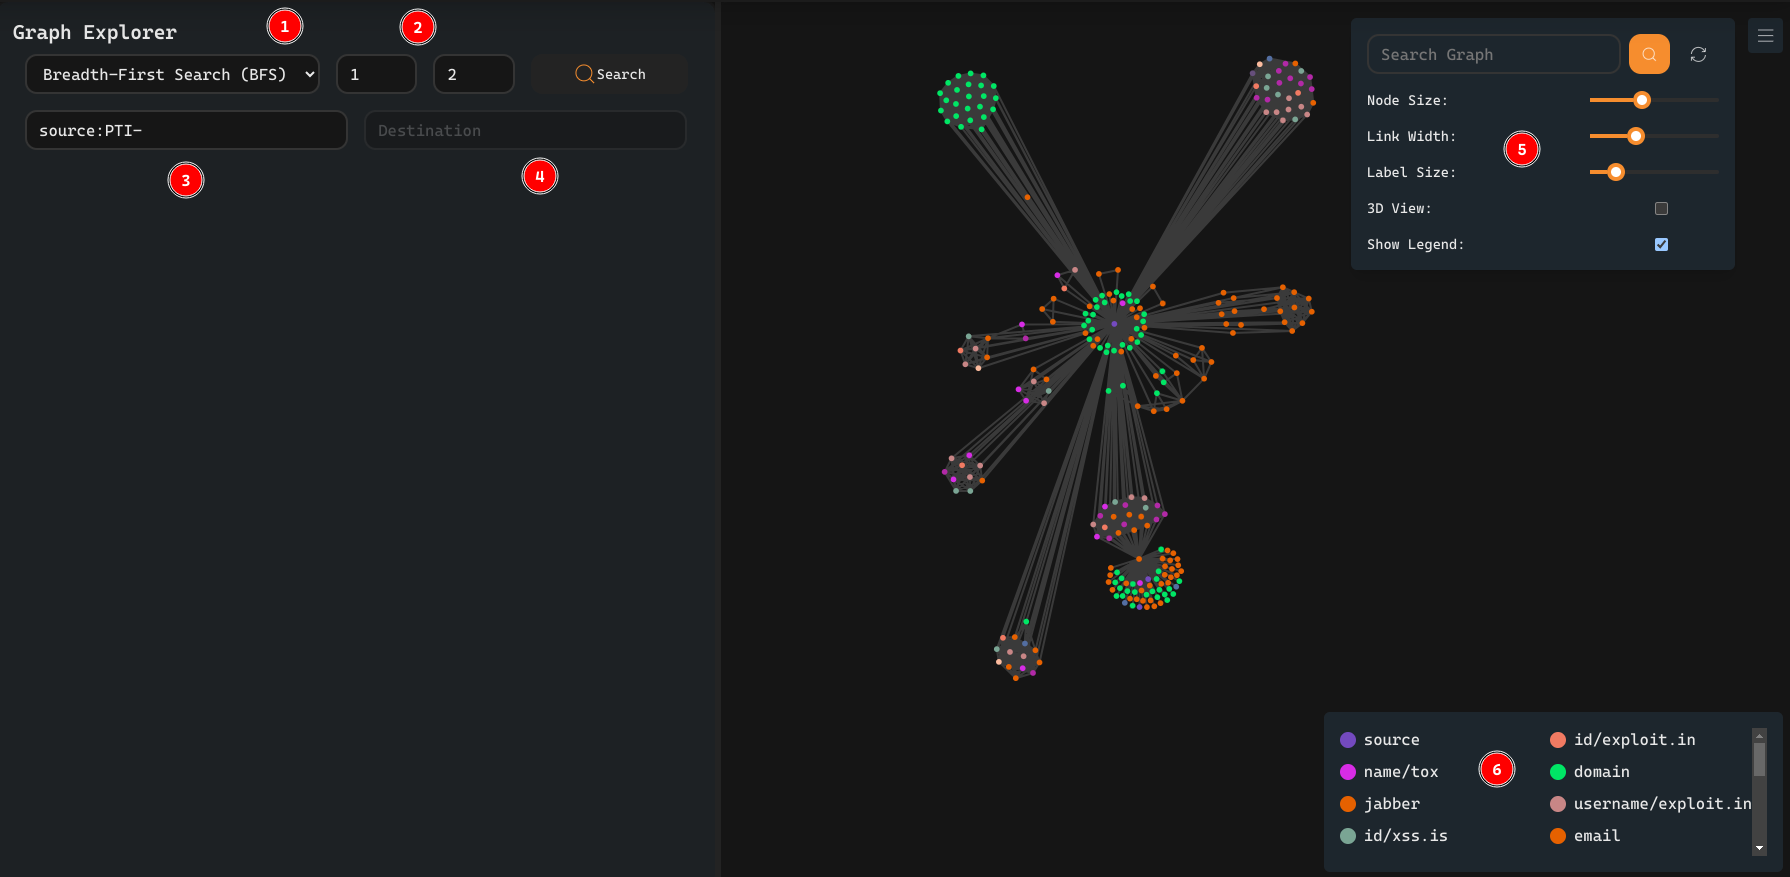
Graph Explorer
The Graph Explorer is a powerful visualization tool designed to help analysts understand relationships between entries in the CRADLE system. It offers an interactive graph view where:
- Nodes represent entities and artifacts.
- Edges represent relationships established through notes.
Querying
The Graph Explorer enables users to search and navigate relationships using advanced graph traversal algorithms. The interface provides several input options to refine searches:
Search Algorithm Selection (1) Choose a graph traversal method to explore relationships. Supported methods include:
- Breadth-First Search (BFS): Explores all nodes up to a specified depth.
- Pathfind: Identifies the shortest path between two nodes.
Depth and Result Limits (2) Specify parameters such as minimum and maximum search depth to optimize query performance.
Source Field (3) Define the starting entity for the search using a category:value format:
- Category represents the entity type (e.g.,
id,email,username). - Value is the identifier within that category.
Examples:
source:PTI-42ipv4:1.1.1.1
- Category represents the entity type (e.g.,
Destination Field (4) (Optional) Specify a target node to filter search results. If left empty, the search will return all connected entities.
Viewing & Browsing
The right-hand side of the interface offers an interactive graph view to explore query results:
Graph Visualization: The generated graph displays nodes (entities and artifacts) and edges (relationships). Nodes are color-coded by category, and clicking an edge reveals the list of notes that established the relationship.
Graph Customization (5): Enhance clarity by adjusting visualization settings:
- Search: Zoom into the relevant node when found.
- Node Size: Change the appearance of nodes.
- Link Width: Modify the thickness of relationship edges.
- Label Size: Adjust text visibility.
- 3D View Toggle: Enable a 3D rendering for better navigation.
- Legend Visibility: Show or hide explanations for node categories.
Legend (6): Click the legend to toggle the visibility of different node categories, helping you better understand the color coding.
By interacting with the graph, users can expand nodes, analyze connections, and explore relationships dynamically.